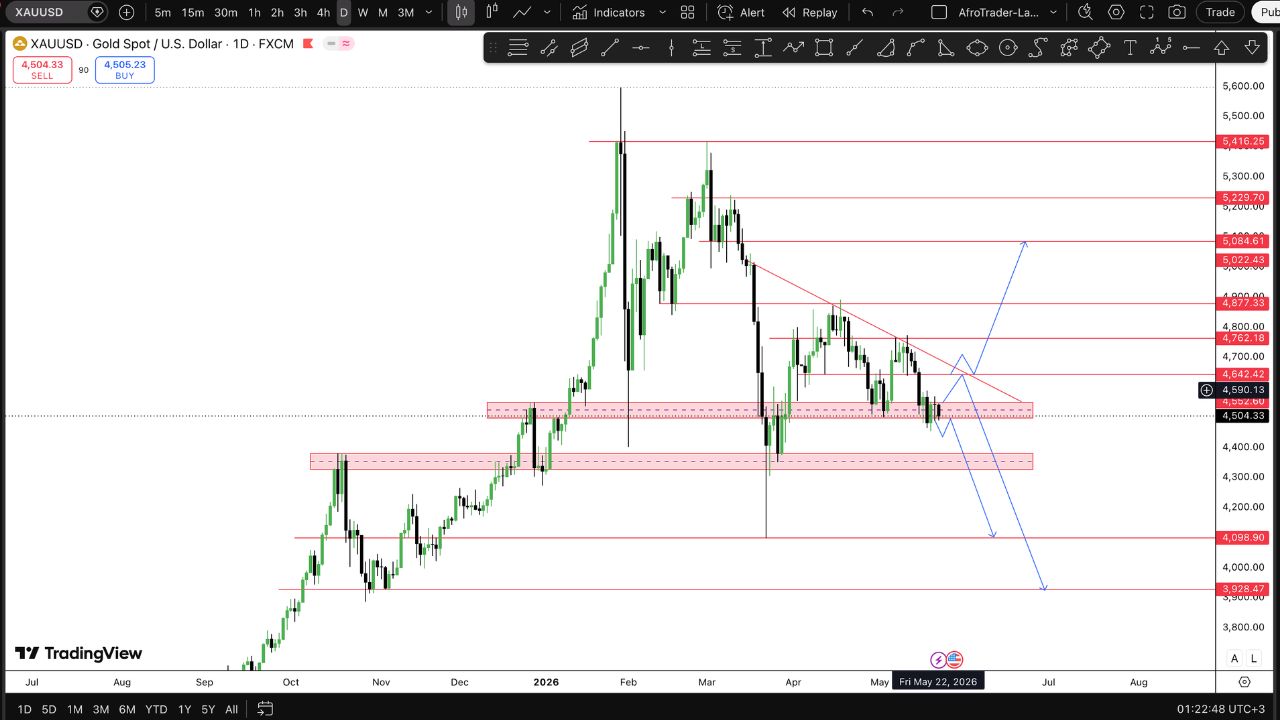
Pair: XAU/USD | Current Price: $4,504 | Timeframe: Daily | Published: May 24, 2026
The Big Picture
Gold has had a remarkable run. From the macro uptrend that began in late 2024, price surged all the way to an all-time high of $5,600, a move that rewarded patient bulls generously. But since that peak, the market has been in a clear corrective phase and right now, price is sitting at one of the most important decision zones on the entire chart.
The question everyone should be asking this week is simple: does this level hold, or does it break?
Key Levels to Know
| Level | Zone | Significance |
| $5,416 | Resistance | Major ceiling |
| $5,229 | Resistance | Prior swing high rejection zone |
| $5,084 | Bull target | Clean TP if trendline breaks |
| $4,960 | Resistance | Intermediate supply |
| $4,877 | Resistance | Prior consolidation ceiling |
| $4,762 | Resistance | 4H supply zone |
| $4,642 | Resistance | Key level – bull case requires close above |
| $4,504 – $4,550 | Decision zone | Where price is RIGHT NOW |
| $4,340 – $4,400 | Support | Major daily demand – bear path target |
| $4,098 | Support | Macro floor |
| $3,928 | Support | Deep macro floor – extreme bear target |
The Descending Trendline – The Most Important Line on This Chart
Since the February highs, gold has been making a series of lower highs, forming a clean descending trendline. This trendline has been respected on three separate touches across March, April, and May making it highly significant.
Currently, that trendline converges with price action right around the $4,600–$4,640 area. Until gold produces a daily close above this trendline, the bears remain in control.
Two Scenarios – One Decision Zone
🟢 Bullish Scenario (40% probability)
Price finds support within the $4,504–$4,550 demand box, prints a strong bullish daily candle (engulfing or pin bar), and begins to reclaim ground. The first confirmation comes with a close above $4,642. A successful break and daily close above the descending trendline then opens the door to:
- TP1: $4,762
- TP2: $4,877
- TP3: $5,084
This path requires a catalyst, either a dovish Fed signal, weak US GDP data (due Thursday May 28), or a fresh escalation in Middle East tensions that brings the safe-haven bid back into gold.
Bull invalidation: A daily close below $4,450 kills this idea immediately.
🔴 Bearish Scenario (60% probability)
Price fails to hold the $4,504–$4,550 zone, trendline resistance caps any bounce, and sellers push gold down into the $4,340–$4,400 demand band, the second demand zone visible on the chart. This is a major daily support that dates back to mid-2025 and should provide a significant reaction.
If that level also fails on a weekly close basis, the next stops are:
- $4,098 – macro floor
- $3,928 – extreme bear scenario, only valid on a full weekly breakdown below $4,098
The bearish case is supported by the current 4H structure (lower highs, lower lows), a near-certain Fed hold in June (97%+ probability of no cut), and a US dollar that remains firm.
Fundamental Drivers This Week
Bearish for gold:
- Fed holds rates at 3.50–3.75% with virtually zero chance of a June cut
- US dollar holding firm, direct headwind for non-yielding gold
- Iran-US peace talks progress reducing safe-haven demand
Bullish for gold:
- US Q1 GDP release Thursday May 28, a weak print could flip the script fast
- Iran reportedly rebuilding military capacity, re-escalation risk remains live
- Central bank gold buying (China, Uzbekistan) continues to provide a structural floor
- Gold remains 34%+ higher year-on-year, macro bull cycle intact
The Trade Plan
If you’re bearish: Watch for a rejection bounce into $4,600–$4,642 (trendline resistance). A 4H bearish engulfing or pin bar at that zone is your sell signal. Target $4,340–$4,400.
If you’re bullish: Do not buy blindly into the demand zone. Wait for a confirmed 1H or 4H change of character (CHoCH), a higher high formation after a sweep of the zone lows. Only then consider a long targeting $4,762 first.
If you’re undecided: The right move is to wait. The GDP print Thursday will likely force a clean directional break. Let the market show its hand first.
Bottom Line
Gold is at a crossroads. The $4,504–$4,550 zone is the battlefield. The descending trendline is the wall. Whoever wins this confrontation, bulls defending demand or bears breaking it, sets the tone for the next move.
Stay patient. Wait for confirmation. Manage your risk.
This gold analysis is for educational purposes only and does not constitute financial advice.
Risk Warning & Disclaimer
Trading Forex, Synthetic Indices, Cryptocurrencies and other leveraged financial instruments involves substantial risk and may not be suitable for all individuals. Leveraged trading can result in losses that exceed your initial capital. At AfroTrader Academy, we emphasize risk management, discipline and long-term consistency not shortcuts or guaranteed profits. The Academy provides educational content only and does not offer financial or investment advice. All trading decisions are the sole responsibility of the individual trader. Past performance does not guarantee future results. Please read our full Risk Disclosure and Disclaimer.


AfroTrader Academy is a professional trading education platform built to equip new and intermediate traders with the knowledge, structure, and discipline required to navigate modern financial markets. We focus on education over hype, process over profits, and skill development over shortcuts. Our mission is to help traders build a solid foundation, understand market behaviour, and develop repeatable trading frameworks they can apply independently.


Interesting take on gold levels here — totally a market vibe I vibe with.